Post 003 - Confusion Matrix
During the fast.ai lession from Jeremy Howard, he mentioned some explanations of the confusion matrix. Depending on the metrics used to train the model, the confusion matrix could show how or what category errors were made in the model. Fast.ai has a built-in function to generate a simple confusion matrix as follows:
 # Generate the Confusion Matrix by using ClassificationInterpretation function
interp = ClassificationInterpretation.from_learner(learn)
# Plot the Confusion Matrix
interp.plot_confusion_matrix(figsize=(8, 8))
Apply the ClassificationInterpretation function from fast.ai library to generate and plot the confusion matrix of the trained model. The example output would be like this:
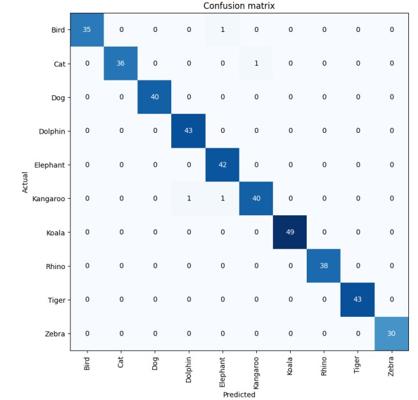
The trained model was about classifying 10 different classes of animals. As shown in this confusion matrix, there were 4 category errors discovered. So, how did these four errors come about? During the fast.ai lession, fast.ai has provided a visualisation tool called plot_top_losses().
# Use plot_top_losses function to plot images in top_losses along with their
# prediction, actual, loss, and probability of actual class.
interp.plot_top_losses(12, figsize=(15, 10))
Only need one single cell, the top_losses images could be visualised. I could find the data such as prediction rate, actual rate, loss, and probability. After that, I could adjust my training parameter to improve my model based on this. :)
